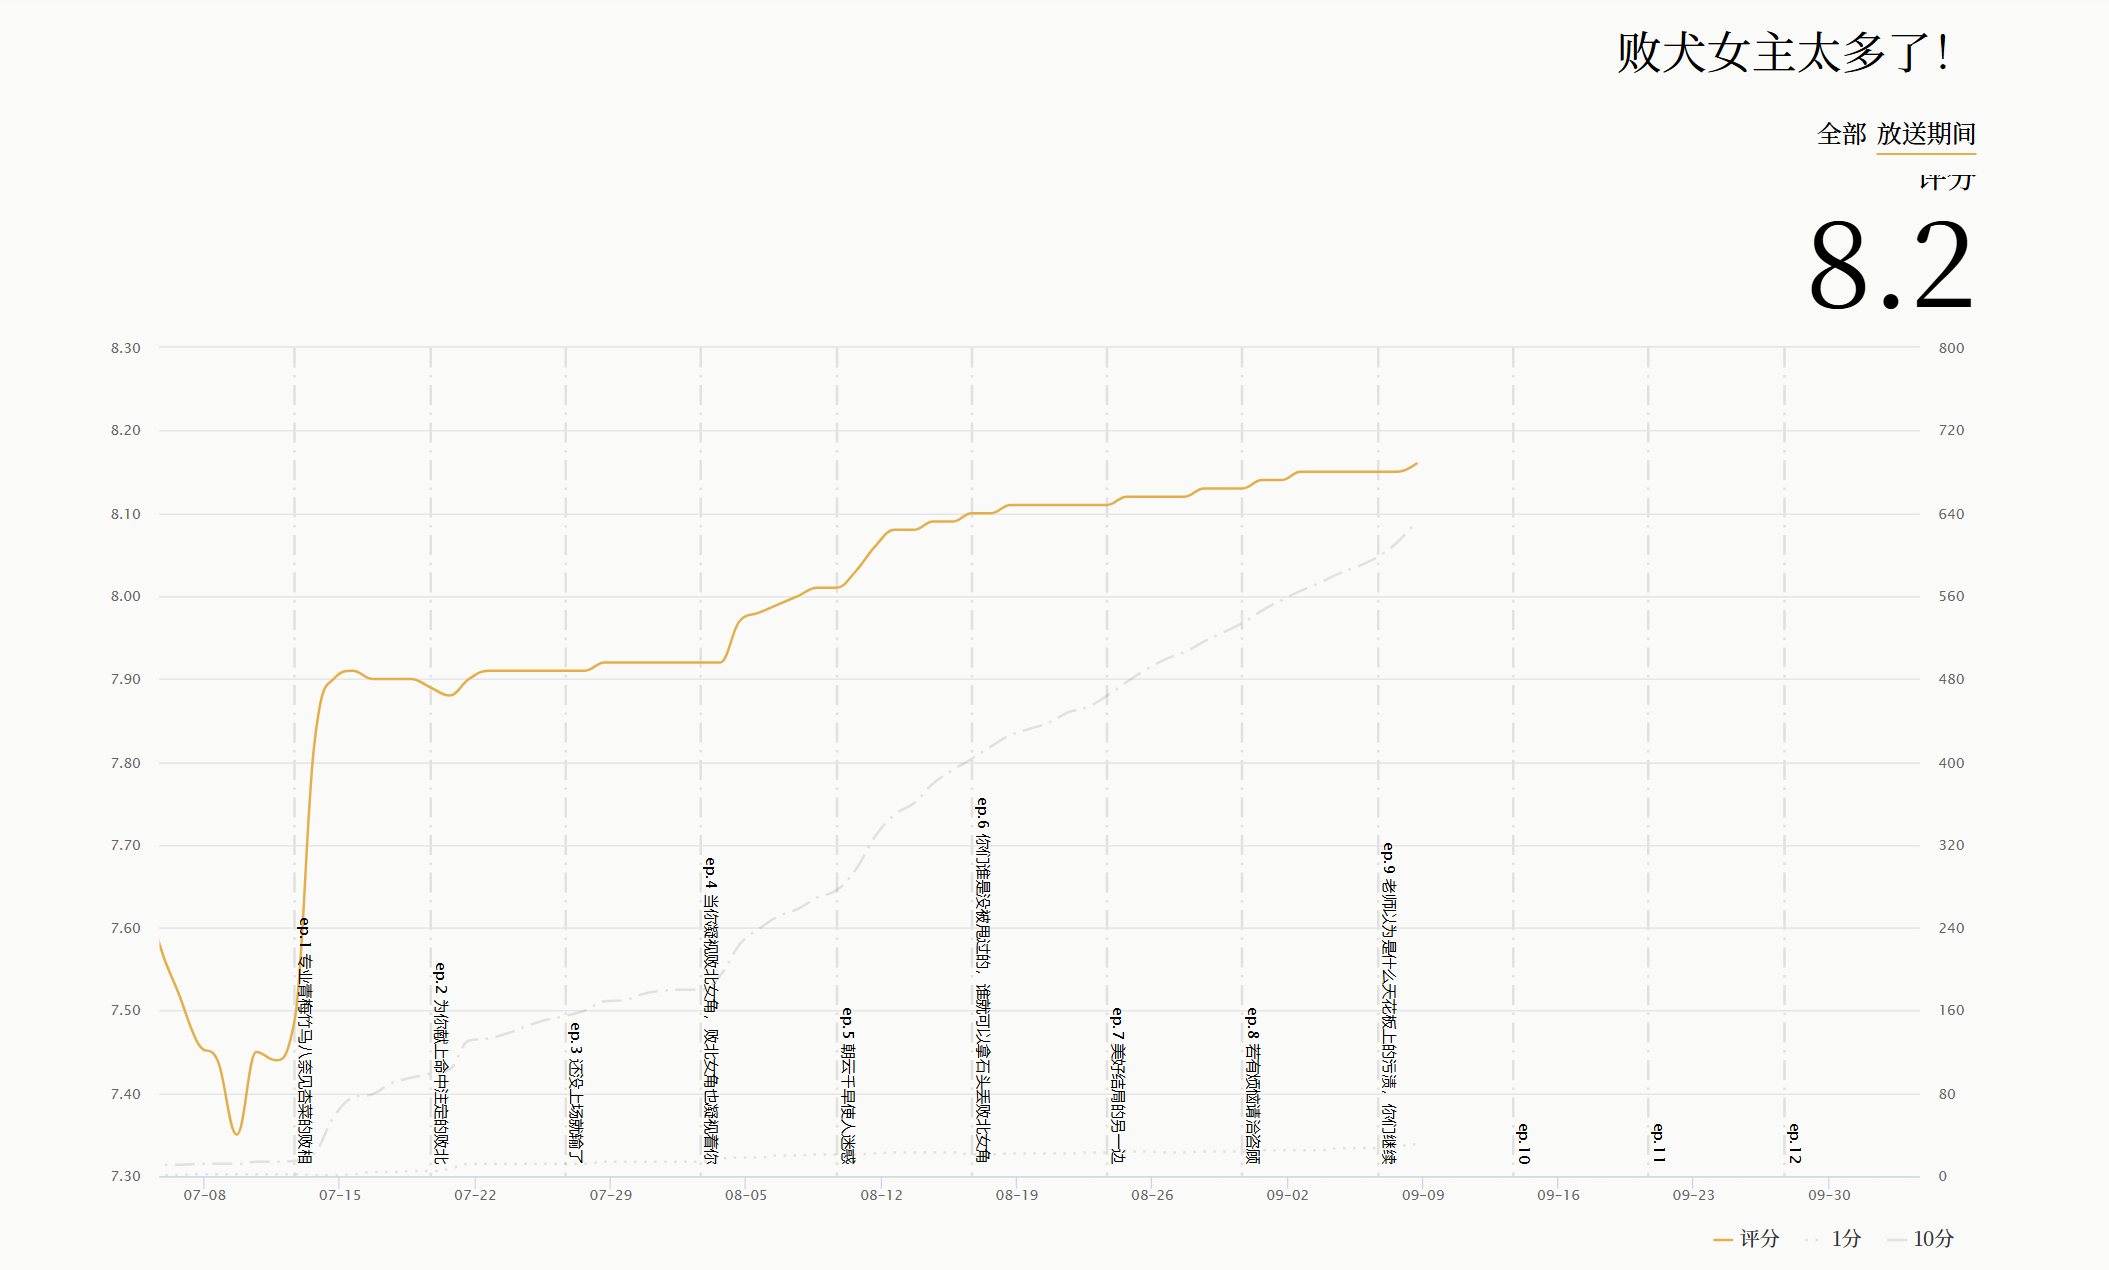
谁才是近几年的番剧“神作”?
有一段时间看bamgumi 上的评分,尤其是评分的排行榜的时候,我就不由得回忆起那些曾经高开低走的动画,在刚开播的时候还能在排行榜前排看到它们,但一道出现了奇怪的结局之后,又早就掉得无影无踪,实在是令人感叹。当然,也有很多的佳作,在刚开播的时候岌岌无名,但最后才发现它其实是唯一真神。
又发现,正好bangumi有了natabare 这样的动画评分历史变化功能,那我不如直接做一个数据可视化,来看出近几年番剧的评分变化是怎么样的。那既然有了点子,那就直接去做吧 !
分析一下网页资源
单个番剧
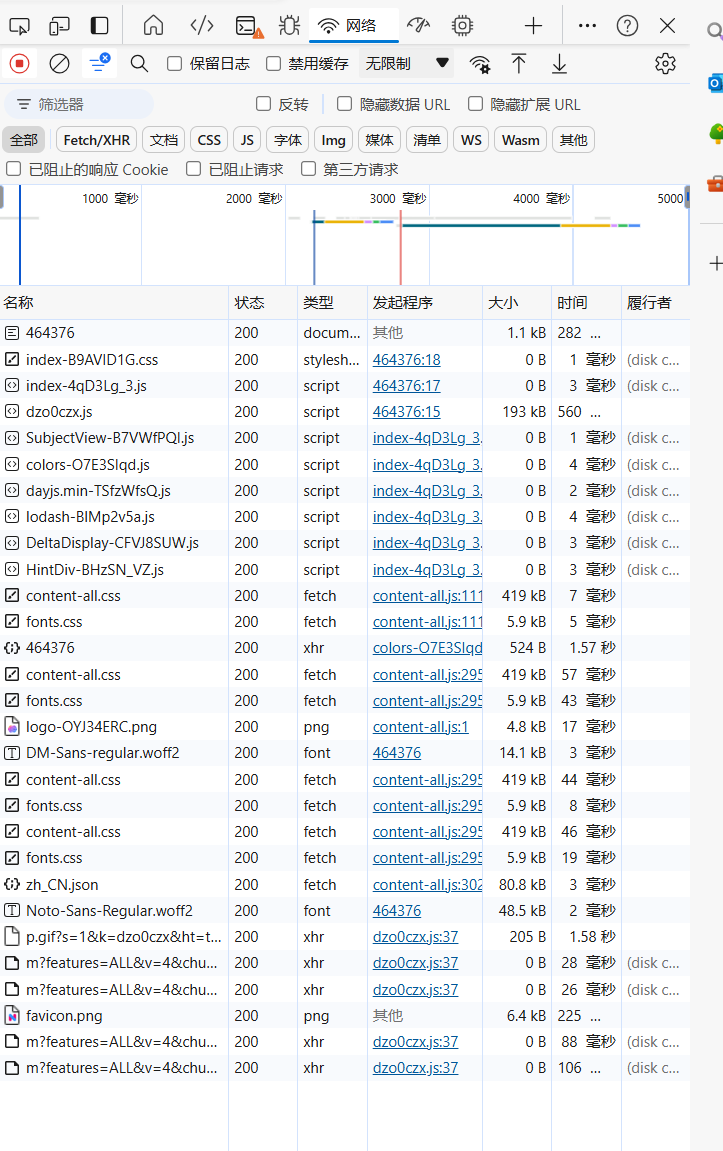
首先要做的第一件事情那就肯定是观察natabare网站的构成,然后找到得到对应数据的办法了。
我们右键审查元素->网络 就可以看到这个网站加载的各种资源。
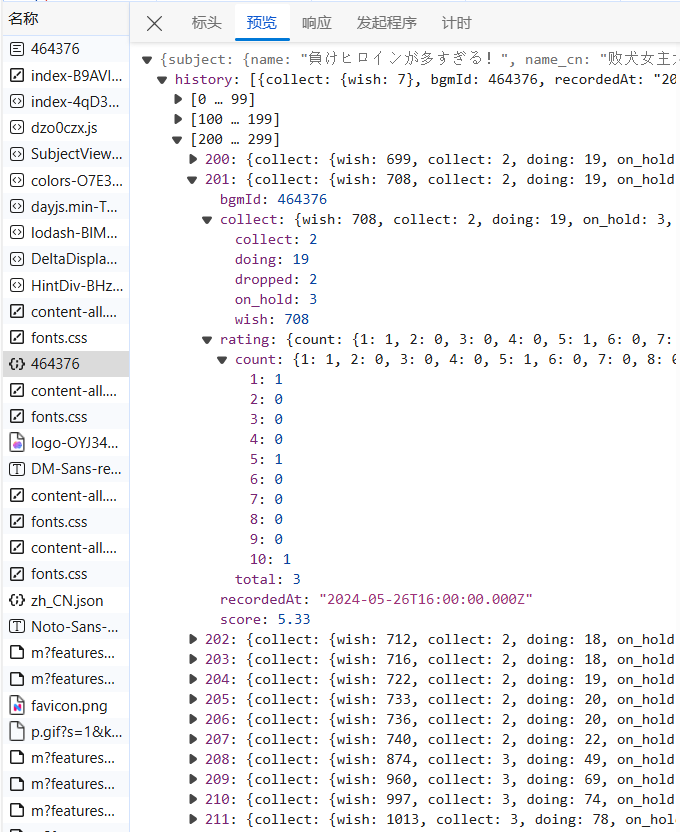
我们注意到 ,其中有一个json文件,这里面记载了这部动画每一天的各种数据。
那么在这里我们就可以很高兴地发现!里面的数据居然已经直接发出来了,根本不需要使用js逆向,或者beautifulsoup之类的其他的较为进阶的爬虫的技术了,我们只要把json接受下来然后对其进行处理,就可以直接搞定了。
我们对网页的资源分析已经完成,接下来就是写代码了。
番剧列表
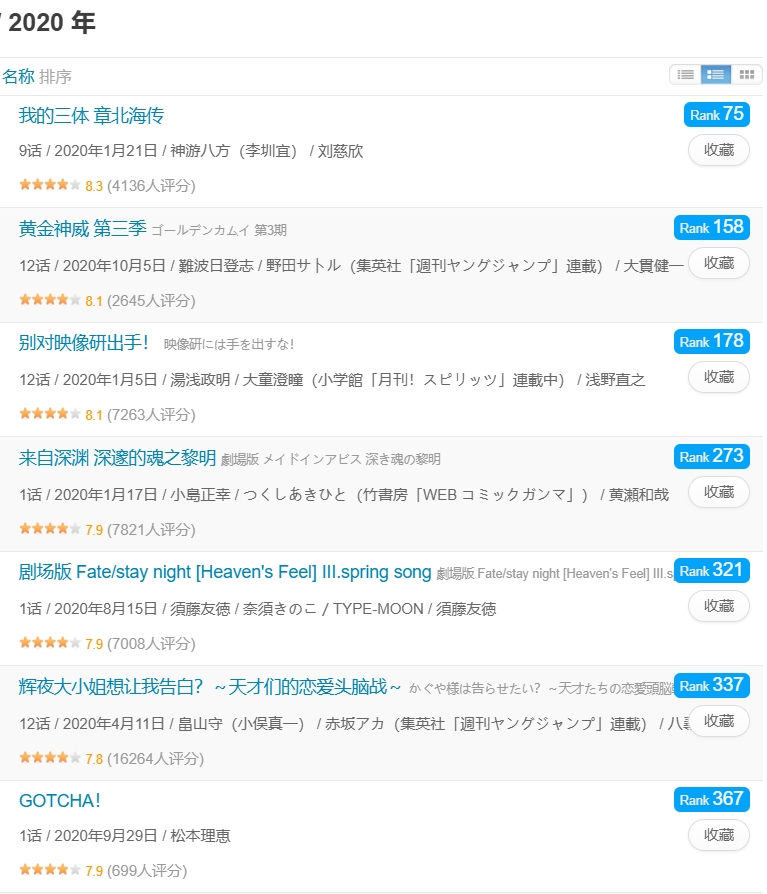
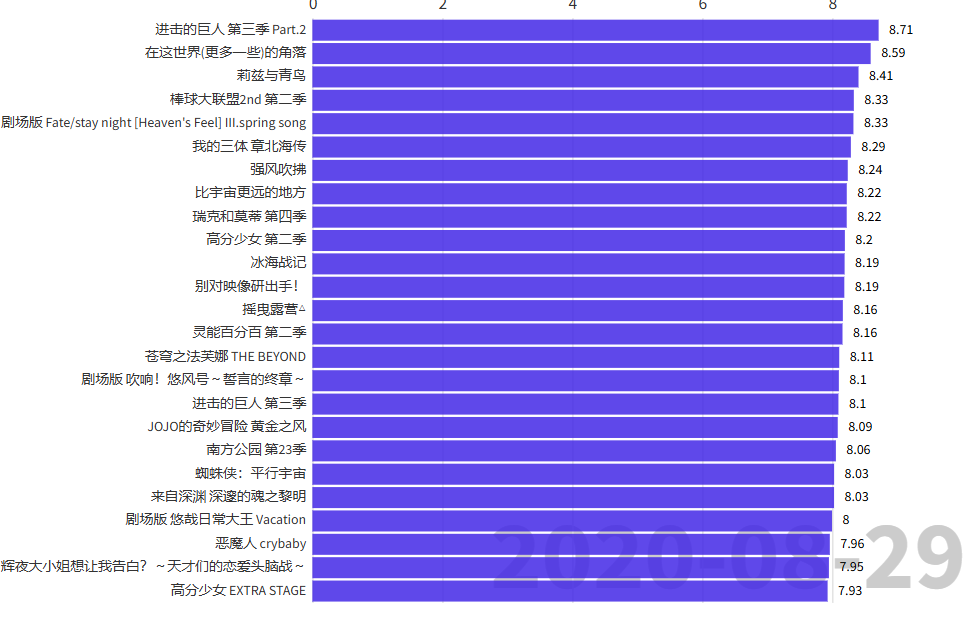
我们选取2020年的评分靠前的动画列表:
我们可以通过获得番剧列表网页,来得到我们所需的评分靠前的动画。
接收资源
本人并没有考虑过接收的效率问题,所以没有使用scrapy,aiohttp等等可能可以非常有效地提升爬取效率的工具,只用了非常朴素的request库,为了方便编写…
获取某一部番剧的json
爬取番剧json的函数大致如下:
1
2
3
4
5
6
7
8
9
10
11
12
13
14
15
16
17
def scrape_data (_id ):'Connection' : 'close' }'User-Agent' ] = random.choice(user_agent_list)str (_id )0 while tries < 5 :try :False , headers=headers, timeout=15 )if (r.status_code != 200 ):return '404' return json_dataexcept requests.exceptions.RequestException:print ('timeout. Retrying in' + str (tries) + '/5' )1
其中最重要的一个步骤可能就是timeout的处理了。如果没有多次尝试的错误处理,最后非常有可能会卡在一半不再运行。因为请求在超出一定时间限制之后,就不会再获得任何信息。
将一部番剧的所有信息用一个类进行处理
1
2
3
4
5
6
7
8
9
10
11
12
13
14
15
16
17
18
19
20
21
22
23
24
25
26
27
28
29
30
31
32
33
34
35
36
37
38
39
40
41
42
43
44
class Anime :def __init__ (self, _id ):id )if raw == '404' :'error' print ('No data for' )else :if raw['subject' ]['name_cn' ] != '' :'subject' ]['name_cn' ]else :'subject' ]['name' ]'subject' ]['air_date' ]def get_score (self, raw ):'history' ]0 False while i < len (score_set)-1 :'recordedAt' ][0 :10 ]1 if compare_air_date(time, self.air_date) == 3 :continue if 'rating' not in score_set[i]:continue 'rating' ]['count' ])if not now_score:continue '%Y-%m-%d' ) + datetime.timedelta(days=-1 )while clock.strftime('%Y-%m-%d' ) not in scores and isopen:'%Y-%m-%d' )] = now_score1 )True return scores
类中存储的信息有: 动画名称 、开播时间(用于筛选较为有用的信息) 、各个时间段的评分 。 其中也内置了一个方法get_score, 用于提取json中的评分信息。
获取番剧列表
我们获取到番剧列表的网站https://bgm.tv/anime/browser/airtime/2020?sort=rank&page=2,其中2020是可替换成各种年份的,而参数page代表了页码号。通过beautifulsoup来获取番剧列表中的元素,得到列表中每一个动画的id。
1
2
3
4
5
6
7
8
9
10
11
12
13
14
15
16
17
18
19
20
21
22
23
24
25
26
27
28
29
30
31
32
33
def get_url (year, page ):"""获取年份,页码对应url""" return "https://bgm.tv/anime/browser/airtime/" + str (year) + "?sort=rank&page=" + str (page)def launch_to_page (year, page ):"""发送get请求""" 'User-Agent' : 'Mozilla/5.0 (Windows NT 10.0; Win64; x64) AppleWebKit/537.36 (KHTML, like Gecko) Chrome/124.0.0.0 Safari/537.36 Edg/124.0.0.0' ,'Connection' : 'close' }return htmldef get_soup (year, page ):"""分析网页进行id的提取""" 'html.parser' )'li' , class_=['item odd clearit' , 'item even clearit' ])'a' )['href' ] for li in soup_of_list]int (li[9 :]) for li in links]return idsdef get_anime_after (year ):"""得到某一年以后的每个番剧构成的列表""" for y in range (year, 2025 ):print ("\n scraping anime page for year " + str (y) + "..." )for page in range (1 , PAGES_LIMIT + 1 ):print ("scraping page: " + str (page) + "..." )return ids
在这里值得一提的,可能就是使用了beautifulsoup的get_soup函数。我们可以分析一下列表的html元素构成:
可以发现,为了做出斑马纹样式,它的列表是作出了奇偶性的分类,所以这两种class都在我们的考虑范围之内。
得到了每一个列表的元素之后,我们再获取它的跳转链接,用切片 获取它的id就好了。
存储数据
写入csv文件
这里我们将所有数据写入csv文件。csv是一种纯文本文件,可以使用它来写入信息到表格中。
1
2
3
4
5
6
7
8
9
10
11
12
13
14
15
16
17
18
def write_files ():'name' ]"%Y-%m-%d" ).tolist())with open ('data.csv' , 'w' , newline='' , encoding='utf-8' ) as csvfile:2018 )0 for _id in ids:1 print ("writing row: " + str (_id ) + "(" + str (cnt) + "/" + str (len (ids)) + ")" )id )if a.score == 'error' :continue 'name' ] = a.name
这样子我们的爬虫就大功告成了。可是怎么样才能让我们获取到的数据显示出来更方便地看到呢?这里就需要数据可视化的作用了。
数据可视化
由于数据是由时间变化的,这里更适合制作一个条形图的视频,这里推荐用flourish 。
我们把自己的数据(csv文件)传入flourish,就可以直接得到视频了。
感谢你读到最后。你也可以点击此链接 看到最后成品。